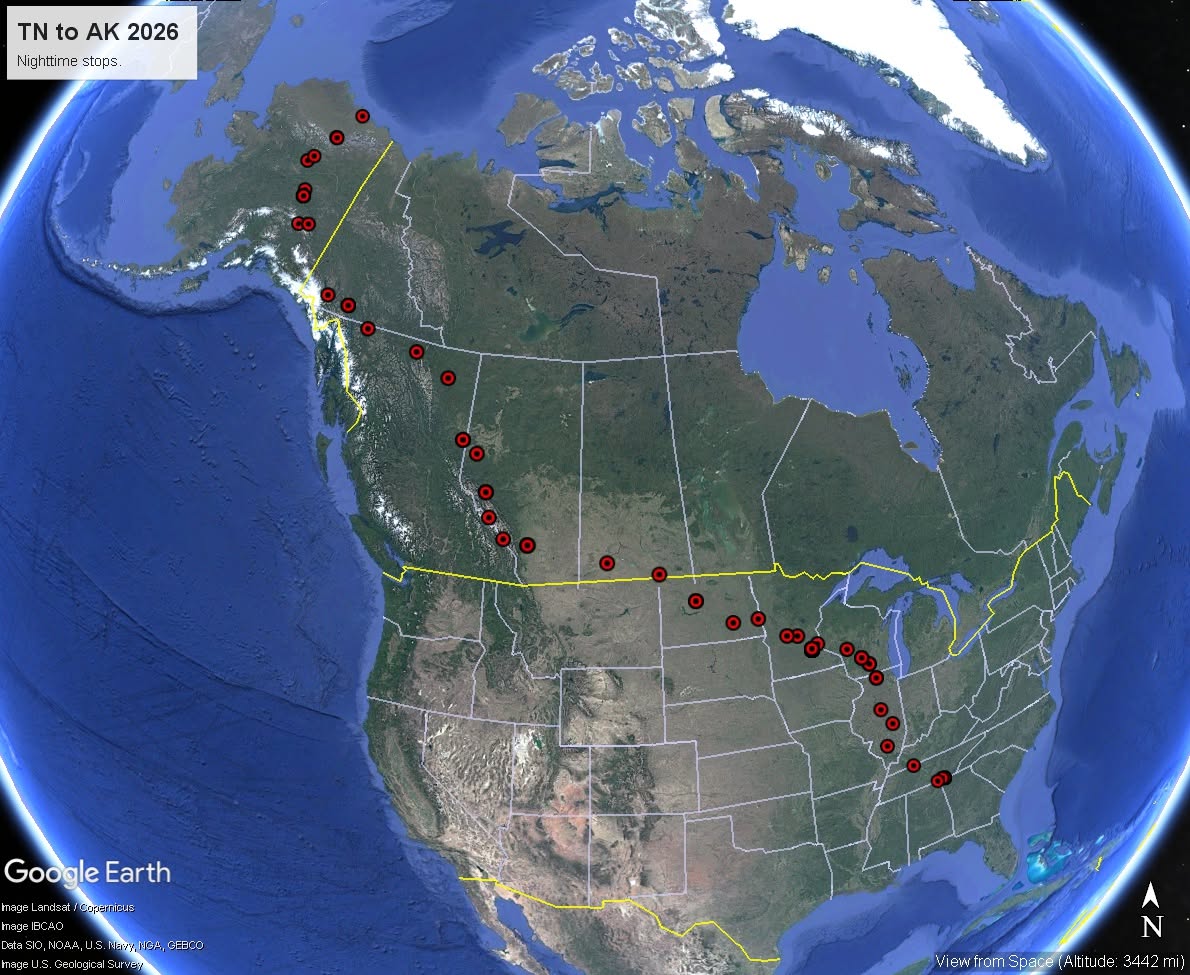
Reconstructing 42 overnight locations from 226,061 GPS observations
by Keith Harper
In 2026, I drove my Ford Transit van from Chattanooga, Tennessee to Deadhorse, Alaska.
When the journey was complete, I had a question:
Where did I actually spend each night?
My Android phone had been collecting Google Timeline location data for years. Somewhere inside that enormous dataset was the answer but the data was not organized around the question I wanted to ask.
What began as a personal curiosity became a practical GIS and data-analysis project: extracting, transforming, filtering, analyzing, validating, and mapping hundreds of thousands of raw location observations into 42 meaningful overnight locations.
The Result
A geographic representation of my 2026 journey showing the locations where I spent each night, reconstructed from historical Google Timeline data using Python, Google Sheets, and QGIS.
Starting dataset: approximately 82 MB
Location observations: 226,061 features
Coordinate system: WGS 84 / EPSG:4326
Final overnight locations: 42
The Problem
A smartphone continuously records location information, but raw location history is not necessarily a useful GIS dataset.
My Timeline contained hundreds of thousands of individual records dating back to 2011. The data included geographic coordinates and timestamps, but it did not contain a field called “overnight location.”
I had to determine:
- Which data was relevant?
- How could I convert it into a GIS-compatible format?
- How could I distinguish a travel day from an overnight stay?
- How should timestamps be interpreted across multiple time zones?
- How could I reduce hundreds of thousands of observations to a manageable analytical dataset?
- How could I verify the resulting coordinates actually represented the places I remembered visiting?
The project therefore became more than mapmaking.
It became an exercise in coordinate-based problem solving and geospatial analysis.
The Workflow
8 Phases of the Analysis
01 — Data Acquisition
Identify and obtain the relevant location-history dataset.
02 — Data Conversion & Preparation
Transform raw JSON into GIS-compatible GeoJSON using Python.
03 — QGIS Import & Inspection
Load, inspect, and understand the resulting spatial dataset.
04 — Temporal Analysis
Develop a logical method for determining which observations represented the end of each travel day.
05 — Overnight Location Extraction
Reduce hundreds of thousands of observations into one meaningful location per night.
06 — Visualization & Symbology
Use QGIS to transform geographic data into an interpretable visual product.
07 — Coordinate & Location Validation
Verify coordinates, investigate anomalies, and cross-reference locations geographically.
08 — Final Analysis & Cartographic Product
Combine the results into maps, supporting data, methodology, and a visual story.
Phase 1 — Data Acquisition
Finding the dataset
My Android phone had accumulated Google Timeline data since 2011.
The relevant Timeline file was approximately 82 MB and contained hundreds of thousands of individual location records.
Rather than beginning with a clean spreadsheet containing a few dozen locations, I was starting with a large, machine-generated dataset.
The first task was data discovery: identifying the relevant source file and understanding what information it contained.
What I had to determine
- Where the geographic data was stored
- What format the data used
- What geographic attributes were available
- Which portion of the historical data was relevant
- Whether the information could ultimately be converted into a usable GIS dataset
Skills demonstrated
Data acquisition • Data discovery • Source evaluation • GPS/location-history data • Data structure awareness
Phase 2 — Data Conversion & Preparation
Turning raw data into spatial data
The original Timeline data was stored as JSON and was not immediately ready for use in QGIS.
I developed a Python-based conversion workflow to transform the JSON data into GeoJSON.
The resulting dataset could then be loaded directly into QGIS as spatial data.
The process can be summarized as:
JSON → Python transformation → GeoJSON → QGIS
The conversion produced a dataset approximately:
- 75.84 MB
- 226,061 features
- WGS 84 / EPSG:4326
Conceptually, this is an ETL workflow:
Extract → Transform → Load
The project also required understanding geographic coordinate systems, including WGS 84 and EPSG codes.
Skills demonstrated
Python • JSON • GeoJSON • ETL • Data transformation • Spatial-data preparation • Geographic coordinates • CRS awareness • WGS 84 • EPSG
Phase 3 — QGIS Import & Inspection
Loading data isn’t the same as understanding it.
Once the GeoJSON dataset was imported into QGIS, the next challenge was determining exactly what I was working with.
I investigated:
- Layer properties
- Feature count
- Coordinate reference system
- Attribute tables
- Available fields
- Timestamp information
- Geographic distribution of points
- Individual feature information
The dataset contained a very large number of individual records.
At times, the information displayed by QGIS did not immediately expose everything I expected to see. Instead of assuming the data was wrong, I had to investigate the underlying structure and determine how the information was actually represented.
This became a practical GIS troubleshooting exercise.
Skills demonstrated
QGIS • Layer management • Attribute-table inspection • Feature inspection • CRS identification • Spatial-data validation • Dataset-structure analysis • GIS troubleshooting
Phase 4 — Temporal Analysis
The question changed.
I wasn’t simply asking:
Where did I go?
I was asking:
Where did I spend each night?
That distinction transformed the project into a spatiotemporal analysis problem.
GPS data does not inherently understand the concept of an overnight stay. It records locations and timestamps as I move through space.
I therefore needed to establish an analytical rule.
The overnight-location rule
One complication was that my journey crossed multiple time zones.
Simply filtering for records after midnight could produce misleading results.
I developed the concept that the location associated with the pre-midnight portion of a travel day represented the place where I ended that day.
This was an important analytical decision.
Rather than allowing the software to determine the answer automatically, I established a logical rule based on the question I was trying to answer.
Skills demonstrated
Temporal analysis • Timestamp interpretation • Date fields • Time-zone awareness • Temporal filtering • Date-range queries • Spatiotemporal reasoning • Analytical-rule development
Phase 5 — Overnight Location Extraction
From hundreds of thousands of observations to 42 meaningful locations
The next challenge was reducing the enormous dataset into something that could actually answer the original question.
The analytical target became:
One overnight location → One date
Instead of working with:
226,061 individual GPS observations,
I created a much smaller dataset representing the overnight locations associated with my journey.
The resulting tabular data could contain:
| Date | Latitude | Longitude | Location |
|---|---|---|---|
| July 21 | XX.XXXX | -XXX.XXXX | Overnight location |
| July 22 | XX.XXXX | -XXX.XXXX | Overnight location |
| July 23 | XX.XXXX | -XXX.XXXX | Overnight location |
The latitude and longitude values could then be used to construct geographic point features in QGIS.
This was the critical data-reduction step of the project.
Skills demonstrated
Data filtering • Attribute querying • Coordinate extraction • Latitude/longitude handling • Point-feature creation • Tabular-to-spatial conversion • Data reduction • Chronological sequencing
Phase 6 — Visualization & Symbology
Turning data into something a person can understand
A large collection of identical geographic points does not automatically communicate a story.
I used QGIS symbology and classification tools to visually distinguish portions of the journey and make spatial patterns easier to interpret.
The objective was to move from:
“a bunch of dots”
to:
a visual representation of movement through space and time.
This required thinking not only about whether the data was technically correct, but also about how the information should be presented to another person.
Skills demonstrated
QGIS symbology • Categorized visualization • Graduated symbology • Point-layer visualization • Cartographic communication • Visual pattern recognition • Map interpretation
Phase 7 — Coordinate & Location Validation
A technically valid result is not necessarily a geographically correct result.
I did not want to simply trust the computer’s output.
Because the final dataset had been reduced to a manageable number of locations, I could inspect individual latitude/longitude coordinates and examine them geographically.
I used QGIS and Google Earth as reference and validation tools.
This allowed me to investigate potential problems involving:
- Latitude/longitude order
- Coordinate formatting
- Coordinate reference systems
- Point placement
- Attribute values
- Geographic location
The goal was spatial QA/QC: verifying that the analytical output made geographic sense.
Skills demonstrated
Coordinate validation • Spatial verification • Geographic reference • QGIS • Google Earth • Coordinate troubleshooting • Data quality control • Cross-platform geographic analysis • Spatial QA/QC
Phase 8 — Final Analysis & Cartographic Product
The purpose of the project was not simply to produce a QGIS file.
The ultimate product was a story about movement, geography, and place.
I took the digital footprint of a months-long journey and reconstructed my overnight geography.
The final project can include:
1. Overview Map
A map showing the geographic extent of the entire journey from Tennessee to Alaska.
2. Overnight-Location Map
A map displaying the individual overnight locations identified through the analysis.
3. Temporal Visualization
A representation of how the overnight locations progressed through time.
4. Supporting Dataset
A cleaned dataset containing fields such as:
- Date
- Latitude
- Longitude
- Location name
- Region/state/province
- Country
- Notes
5. Methodology
A concise explanation of how the overnight locations were identified.
6. Technical Workflow
Google Timeline → JSON → GeoJSON → QGIS → Filtering → Overnight Dataset → Visualization → Validation
What This Project Demonstrates
Rather than treating the project as a collection of isolated software skills, the workflow demonstrates the ability to take an ambiguous real-world question and turn it into a structured analytical process.
GIS
QGIS • Spatial data management • Layer creation • Spatial analysis • Cartography • Symbology • Coordinate systems
Data
JSON • GeoJSON • CSV • Tabular data • Data transformation • ETL • Data cleaning • Data validation
Spatial
Latitude/longitude • GPS data • Point features • WGS 84 / EPSG:4326 • Spatial visualization • Spatial verification
Temporal
Dates • Timestamps • Time zones • Temporal filtering • Spatiotemporal analysis
Analytical
Problem formulation • Methodology development • Rule creation • Pattern recognition • Data reduction • Quality control • Troubleshooting
Professional
Independent research • Technical problem solving • Learning unfamiliar technology • Iterative workflow development • Translating a real-world problem into a GIS workflow • Communicating results visually
The Alaska Journey as a Portfolio Laboratory
This project is only the beginning.
The same journey that produced the overnight-location dataset contains numerous additional questions that can be explored geographically.
From the same underlying travel experience, additional projects can examine:
- Gas consumption and fuel-cost spatial analysis
- Travel-route analysis
- Elevation and terrain analysis
- Distance and travel-time analysis
- Weather versus travel patterns
- Campsite and overnight-location suitability
- Alaska Highway infrastructure
- Points of Interest
- Heat Mapping
- E-bike exploration mapping
- Public-land and recreation GIS analysis
One journey can therefore become a portfolio laboratory and a real-world environment in which I can continue developing GIS, data-analysis, cartographic, and research skills.
Demonstrable Skillset
This project began with a simple personal question:
Where did I actually spend my nights during my journey to Alaska?
Answering it required considerably more than placing points on a map.
I had to acquire and understand a large dataset, transform its structure, make it usable in GIS, interpret timestamps, account for time zones, establish an analytical rule, filter hundreds of thousands of records, extract meaningful coordinates, create spatial features, visualize the results, troubleshoot unexpected behavior, and validate the geographic output.
The result was a transformation:
226,061 raw observations → 42 meaningful overnight locations → a map that tells the story of the journey.
More importantly, the project represents a deliberate shift in how I approach the world.
I am no longer simply experiencing a journey and moving on to the next one.
I am collecting the evidence, analyze the patterns, map what I discover, and communicate the story contained within the data.